Overview
Relationships are the connective tissue of Monoscope’s strategic system. They define how initiatives and metrics (outcomes) influence each other — forming the structural backbone for how strategy is analysed, visualised, and reasoned about.
Every Monoscope Canvas is built on these relationships. They turn isolated data points into a system of cause and effect, enabling teams to move from observation to understanding — and from intuition to structured reasoning.
Relationships are what make the Strategy Graph intelligent — they transform static plans and metrics into a dynamic, analyzable network.
Why Relationships Matter
Without relationships, initiatives and metrics exist as disconnected artifacts. You can see what is happening, but not why.
By defining relationships, you:
- Connect effort to impact
- Understand dependencies across initiatives
- Reveal feedback loops that create compounding growth
- Provide the foundation for all strategic analyses
- Preserve coherence between distributed canvases
Relationships make the invisible visible — describing how strategy actually works beneath the surface.
Types of Relationships
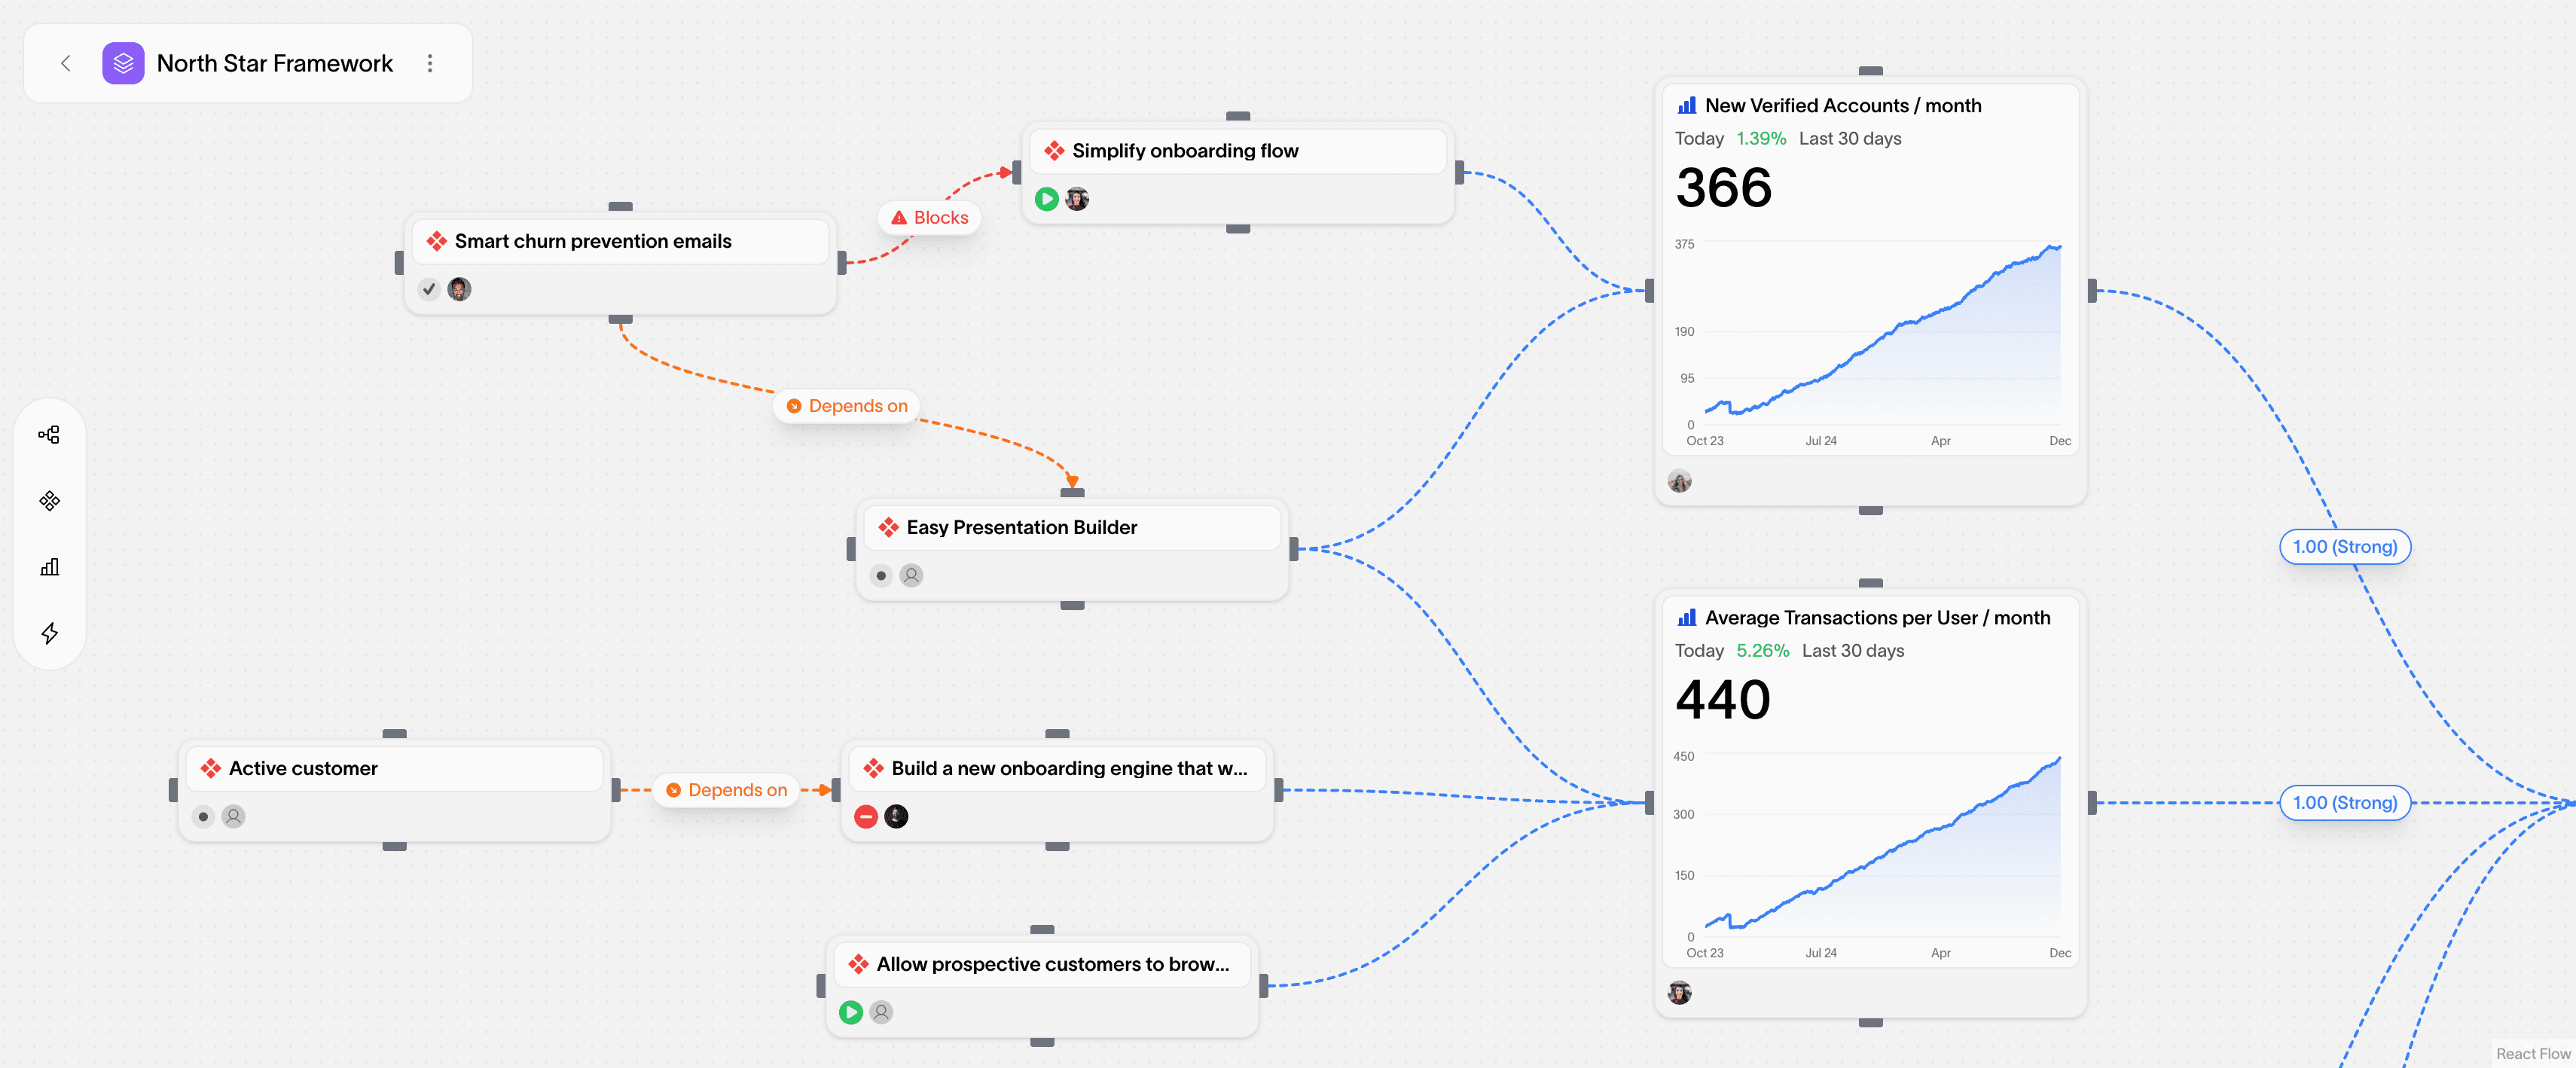
Relationships describe directional influence between entities. Each has a source, a target, and a type that defines the nature of influence.
| Type | Description | Example |
|---|---|---|
| Initiative → Metric | A initiative contributes to or affects a metric. | “Improve onboarding increases signup conversion.” |
| Metric → Metric | One metric influences another — basis for causal and driver analyses. | “Activation rate drives retention rate.” |
| Initiative → Initiative | One initiative enables or depends on another. | “Infrastructure upgrade enables mobile relaunch.” |
| Metric → Initiative | A metric constrains or enables progress on an initiative. | “API uptime enables performance improvements.” |
Relationship Attributes
Each relationship type carries specific analytical attributes, determined by the kinds of entities it connects. Monoscope automatically adjusts what metadata and analyses apply based on whether you’re connecting initiatives, metrics, or both.
1. Initiative → Metric
Describes how an initiative (Initiative) is expected to influence an outcome (Metric). Used in Initiative Impact Analysis and Growth Loop Analysis.
Attributes
- Impact Direction:
positive,negative,neutral - Confidence Level:
low,medium,high - Reach: estimated proportion of users or systems affected
- Lag: expected delay between cause and effect
- Relationship Type:
contributes_to,drives,enables,blocks,depends_on
2. Metric → Metric
Describes correlative relationships between outcomes. Used in Driver Analysis and Growth Loop Analysis.
For metric-to-metric links, the Pearson correlation helps Monoscope measure analytical confidence — distinguishing perceived influence from actual data correlation.
3. Initiative → Initiative
Describes dependencies or sequencing between initiatives. Used for roadmap coherence, cross-team coordination, and dependency mapping.
Attributes
- Type:
depends on,blocks,enables,affects,leads to,correlates with,aligns with,contributes to,maps to,part of,produces,consumes,mitigates,duplicates - Confidence: optional — qualitative (based on delivery risk)
- Lag: optional — may represent project sequencing
How Relationships Power the System
1. Cross-Canvas Integration
A initiative or metric can appear in multiple Monoscope Canvases. Monoscope unifies its relationships across contexts to provide a 360° view of its system role.
2. Strategy Graph
All relationships form the Strategy Graph — a living, workspace-wide map of causes, effects, and dependencies that Monoscope uses to detect conflicts, overlaps, and leverage points.
Relationship Management
When viewing any initiative or metric, you can inspect all its relationships across all canvases.
This view helps teams:
- Understand an initiative’s system context
- Identify which metrics or initiatives it touches across teams
- Spot dependency risks early
- Trace how one change cascades through related metrics
All relationships are two-way visible — if a initiative connects to a metric, that same link is visible when viewing the metric. This ensures transparency and coherence.
Avoiding Conflicts Between Canvases
As workspaces scale, multiple teams may work with overlapping metrics or initiatives. Without unified relationships, this leads to fragmentation.
Monoscope prevents this by:
- Recognising duplicate entities across canvases
- Unifying relationships into a single source of truth
- Highlighting divergent assumptions
- Providing visibility into dependencies across teams
Best Practices
- Be explicit about intent. Define if the relationship is causal, enabling, or blocking.
- Use confidence and lag. These make analyses statistically meaningful.
- Review quarterly. Validate assumptions as data evolves.
- Avoid redundancy. Each relationship should represent a distinct influence.
- Encourage shared context. If multiple teams affect the same metric, align on relationship structure.
Summary
Relationships between initiatives and metrics form the foundation of Monoscope’s strategic intelligence. They link effort to impact and describe how your strategy behaves as a system.
By mapping these relationships — within and across Monoscope Canvases — Monoscope constructs a Strategy Graph that powers every analysis, quantifies influence, and keeps your workspace’s strategy coherent, measurable, and alive.