Introduction
Initiatives represent your strategic hypotheses — connecting ideas to measurable outcomes.
What Are Initiatives?
In Monoscope, Initiatives are the building blocks of your strategy. They capture your team’s strategic hypotheses — what you believe will move a metric or achieve a goal — and make them explicit, measurable, and trackable.
Every initiative combines intent, execution, and learning in one place.
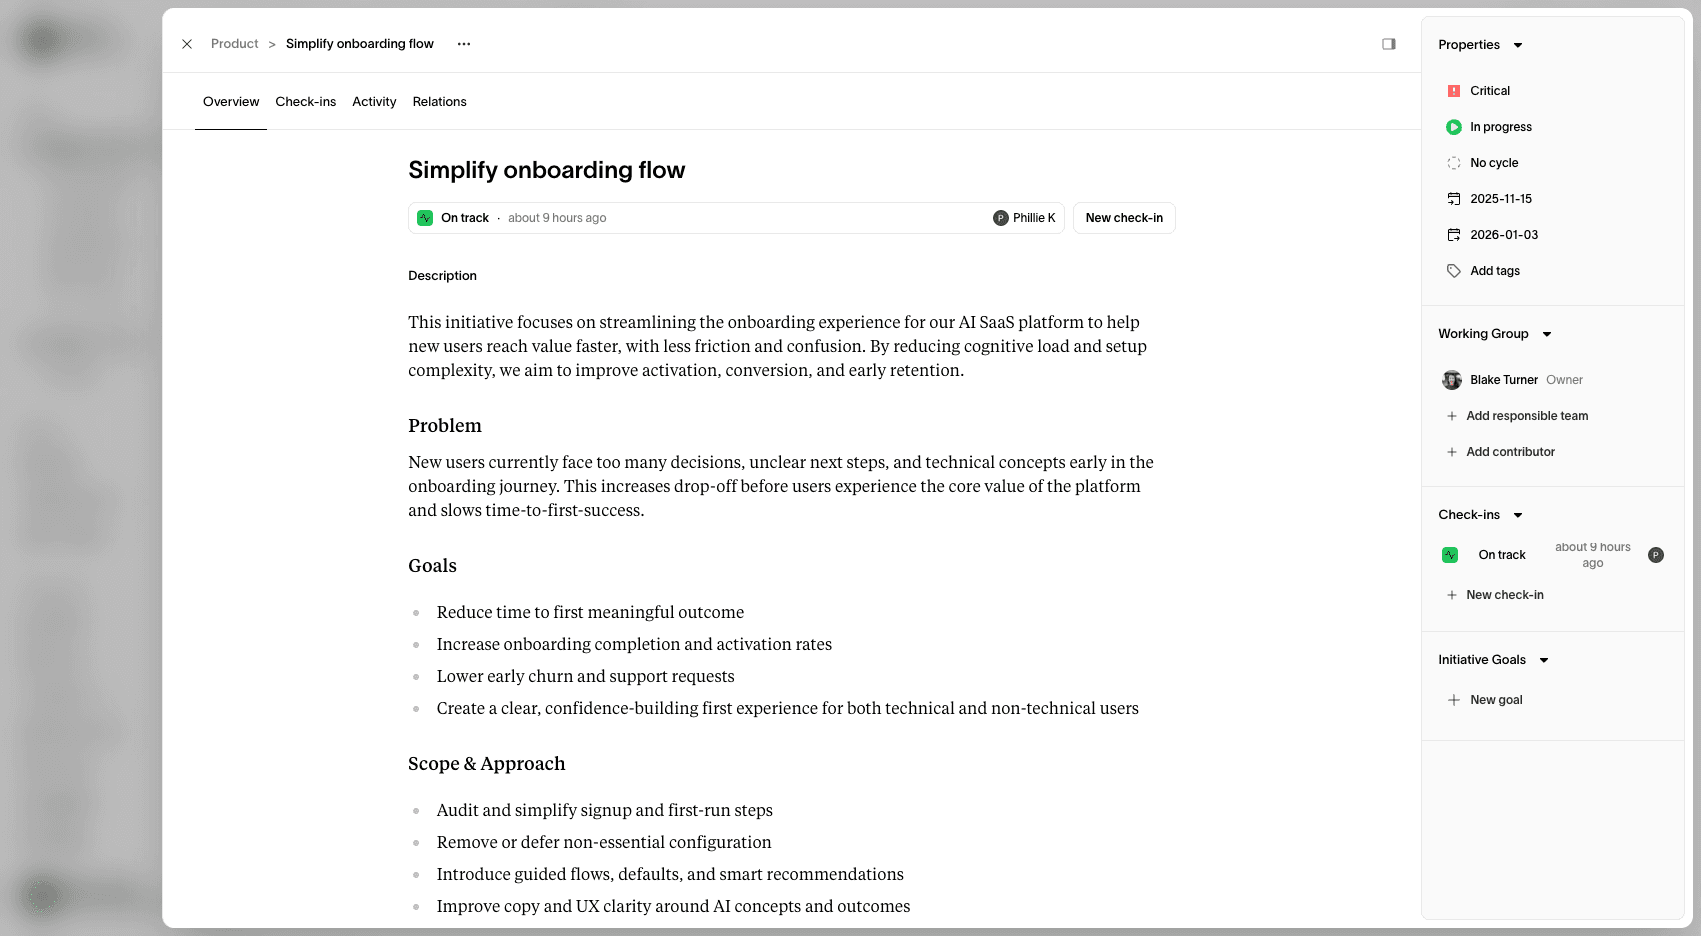
Initiatives sit at the heart of your Monoscope Plan, Monoscope Canvas, and the Strategy Graph, linking work and metrics together. They answer three essential questions:
- What do we believe will create impact?
- How will we know if it’s working?
- What did we learn?
Why Initiatives Matter
Strategy often fails because intent and execution drift apart. By making initiatives explicit, teams can:
- Align around clear hypotheses and outcomes
- Focus resources on high-impact work
- Learn systematically from what succeeds or fails
- Connect short-term actions to long-term goals
Each initiative becomes a strategic conversation artifact — visible, contextual, and connected.
Initiatives are not just tasks — they’re structured initiatives on how your product or strategy will grow.
The Flow of a Monoscope Initiative
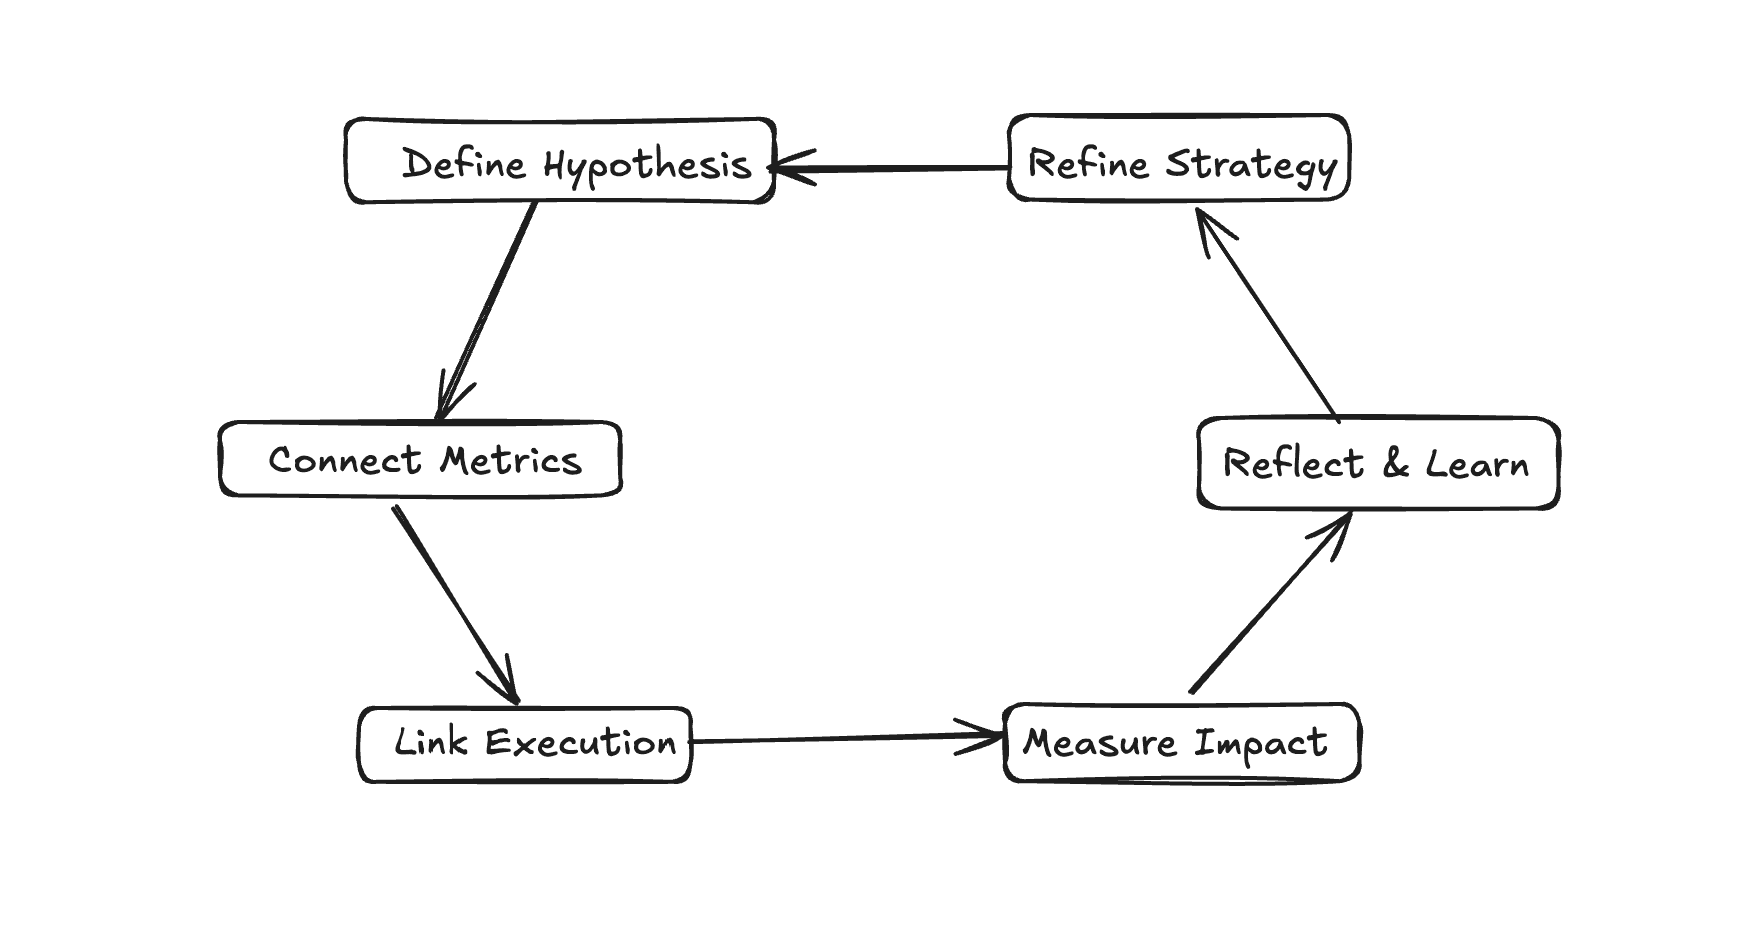
An initiative moves through the full strategy loop:
- Frame the hypothesis — define what you believe will create impact.
- Connect metrics — specify which outcomes should move.
- Link execution — attach work from Jira, Linear, or other tools.
- Measure results — track actual impact vs. predicted outcomes.
- Reflect and learn — close the loop to strengthen future initiatives.
Initiatives in the Strategy Graph
Initiatives are the connective nodes that bring your strategy to life. They form edges between metrics, goals, and work, making it possible to visualize cause and effect across the organization.
- Each initiative links upward to the goals or outcomes it supports.
- It links sideways to other initiatives within the same theme or team.
- It links downward to the execution and data that measure its success.
This network of relationships is what powers Monoscope’s Strategy Graph — allowing teams to see alignment, duplication, and interdependencies at a glance.
Example
Let’s say your company wants to increase user retention. You might create the following initiatives:
- “Improve onboarding completion rate” → linked to the Activation metric.
- “Launch referral incentives” → linked to the Engagement metric.
- “Redesign subscription flow” → linked to the Revenue metric.
Each one can be tracked through metrics, connected to relevant projects, and evaluated after completion.