Settings
Metric Types
Monoscope’s strategy mapping tool is inspired by Amplitude’s North Star Playbook, created by John Cutler and Jason Scherschligt. This framework provides a structured model to define how work and metrics relate to each other.
There are three types of metrics in Monoscope, positioned along a spectrum from leading to lagging indicators:

- Input Metrics – Leading indicators influenced by work. For example, the percentage of users performing a specific action during a session. While important, they do not directly represent business success.
- North Star Metric – Measures the value delivered to customers. Increasing this metric generally leads to happier users and business growth. It serves as a bridge between leading and lagging indicators. A rule of thumb: each product should have one North Star Metric.
- Business KPIs – Lagging indicators that measure business success, such as revenue or customer retention. Since they are subject to external factors, they are difficult to influence directly through work.
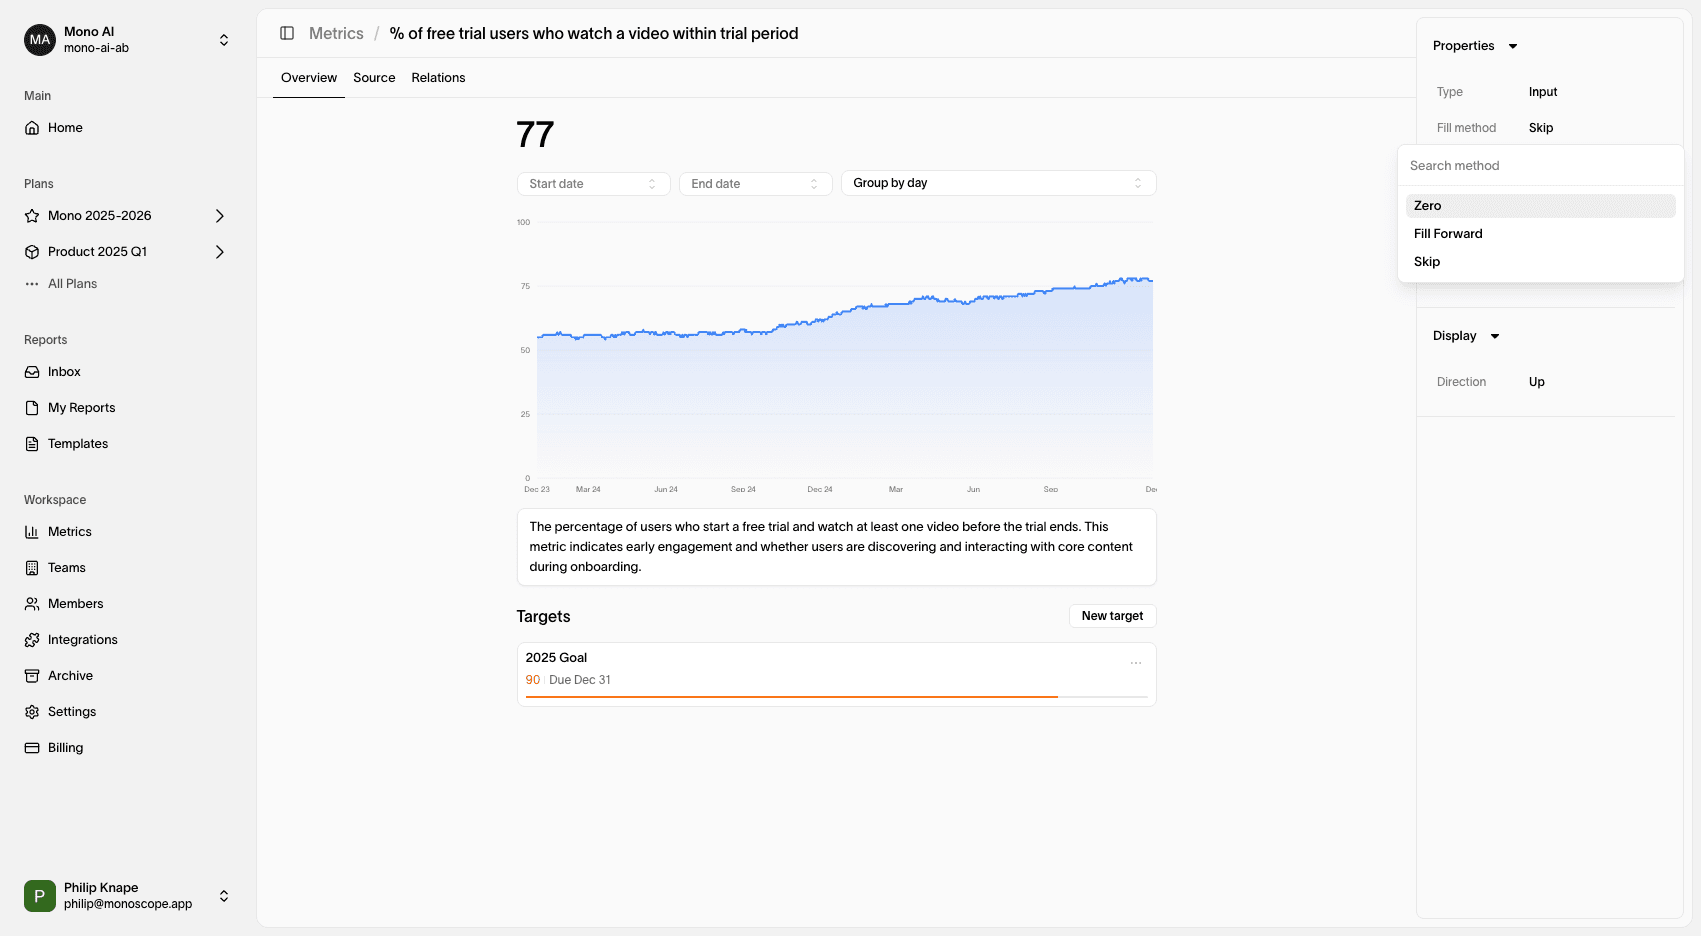
Fill Method
The fill method setting controls how missing data is handled.
| Fill Method | Description |
|---|---|
| Skip | Missing data is skipped. |
| Zero | Missing data is filled with zero. |
| Previous | Missing data is filled with the previous value. |
| Next | Missing data is filled with the next value. |
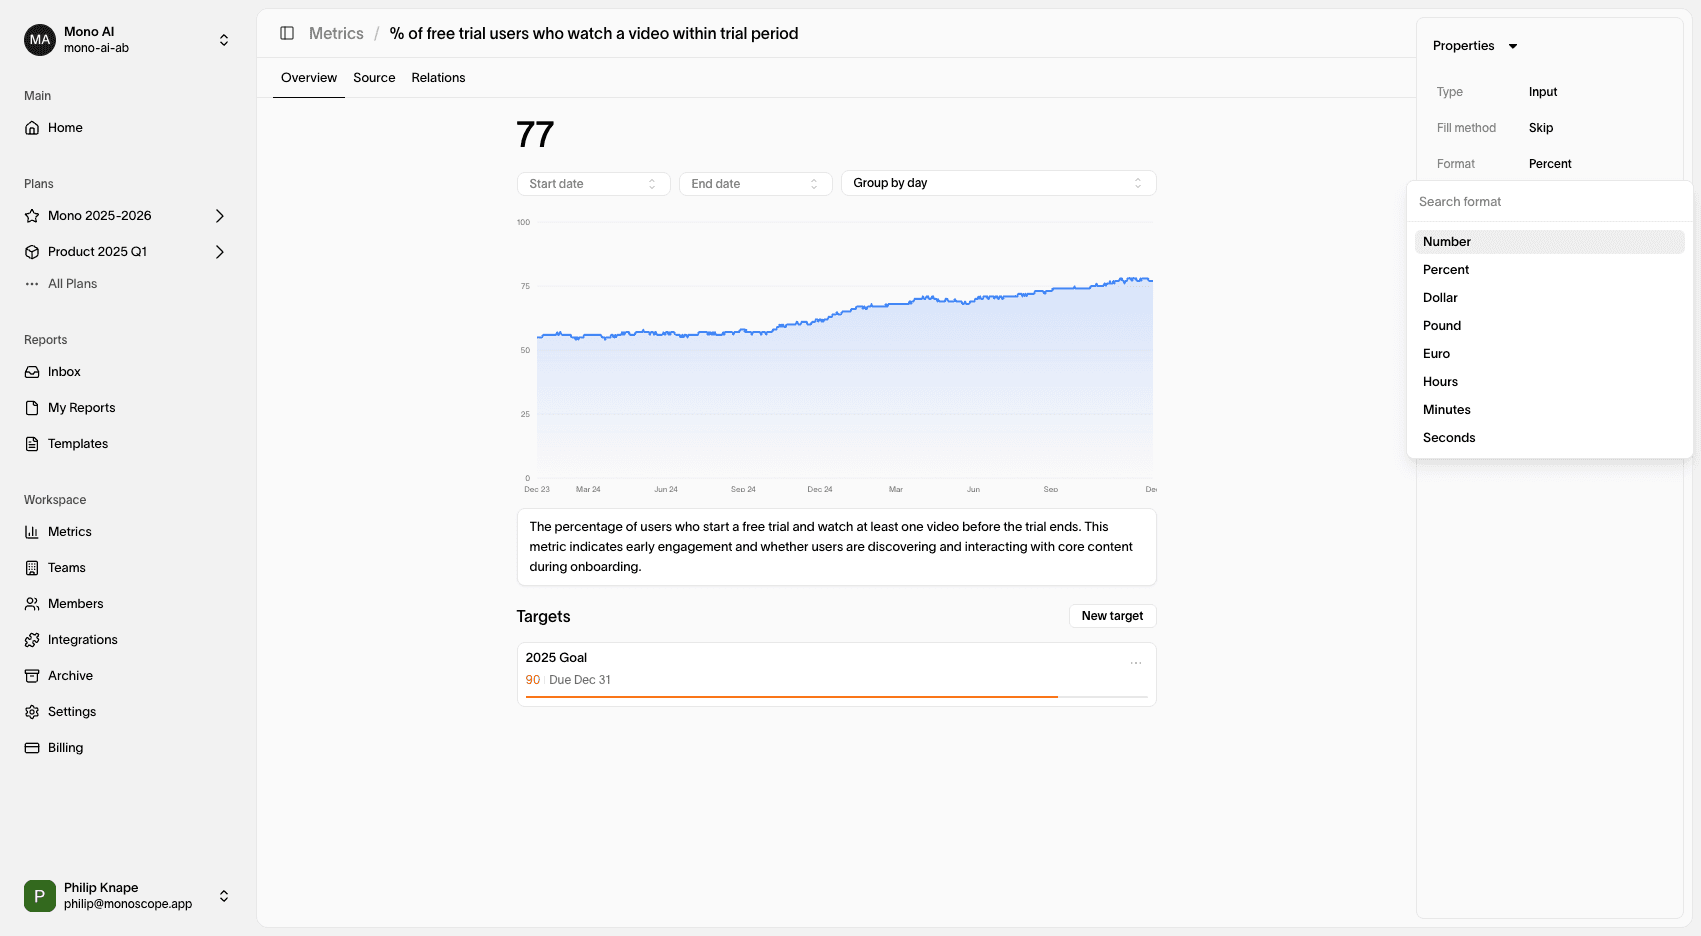
Format
The format setting controls the symbol displayed alongside metric values. For instance, when tracking Revenue, selecting a currency format ensures that values appear correctly.
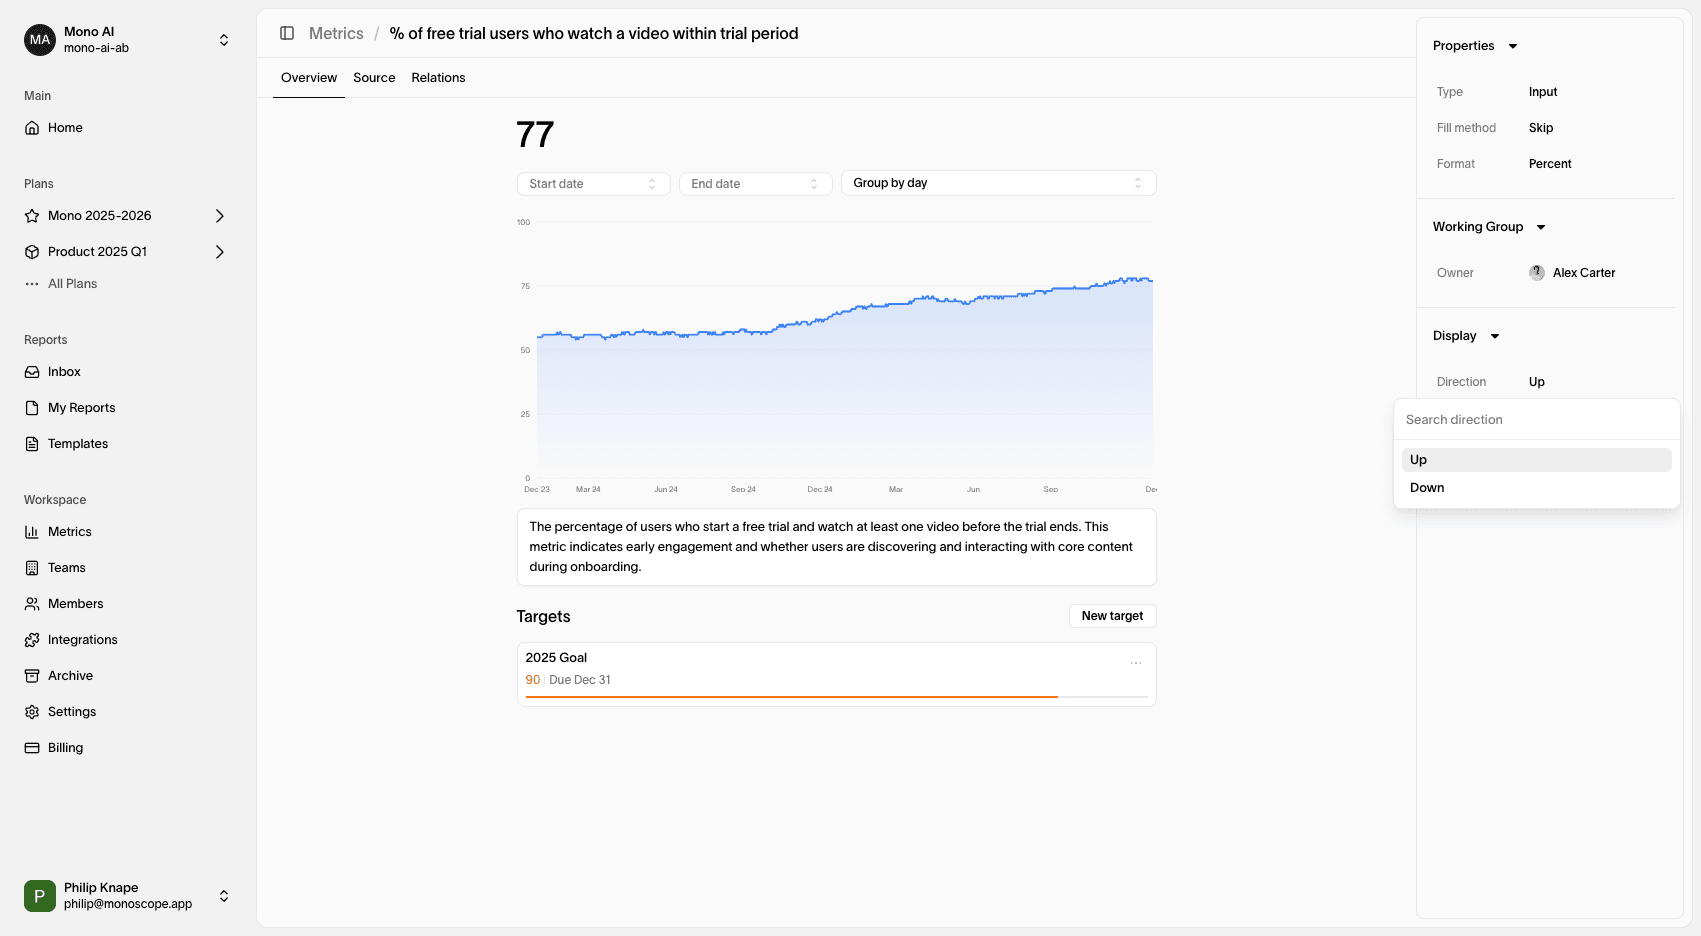
Positive Direction
The percentages displayed beneath each metric indicate performance changes compared to the previous period of the same length.
For example, if a metric’s roll-up value is 5 for the last 7 days and was 4 in the previous 7-day period, the percentage change would be 25%.
Formula for Percent Change:
(Current Period - Previous Period) / Previous Period