Track progress toward your outcomes with automatically calculated targets.
What Are Targets?
Metrics tell you what’s happening — targets define where you’re going.
A target represents a specific target attached to a metric. It lets teams measure progress toward a desired outcome over time, such as:
- “Increase weekly active users to 10,000 by Q4”
- “Reduce churn rate below 2% by year-end”
- “Reach 1M monthly revenue by June”
Monoscope automatically calculates progress between the start and end dates using your chosen aggregation method, so you always know whether you’re on track.
Targets transform metrics from passive indicators into active commitments — helping teams align on measurable, time-bound outcomes.
Creating a Target
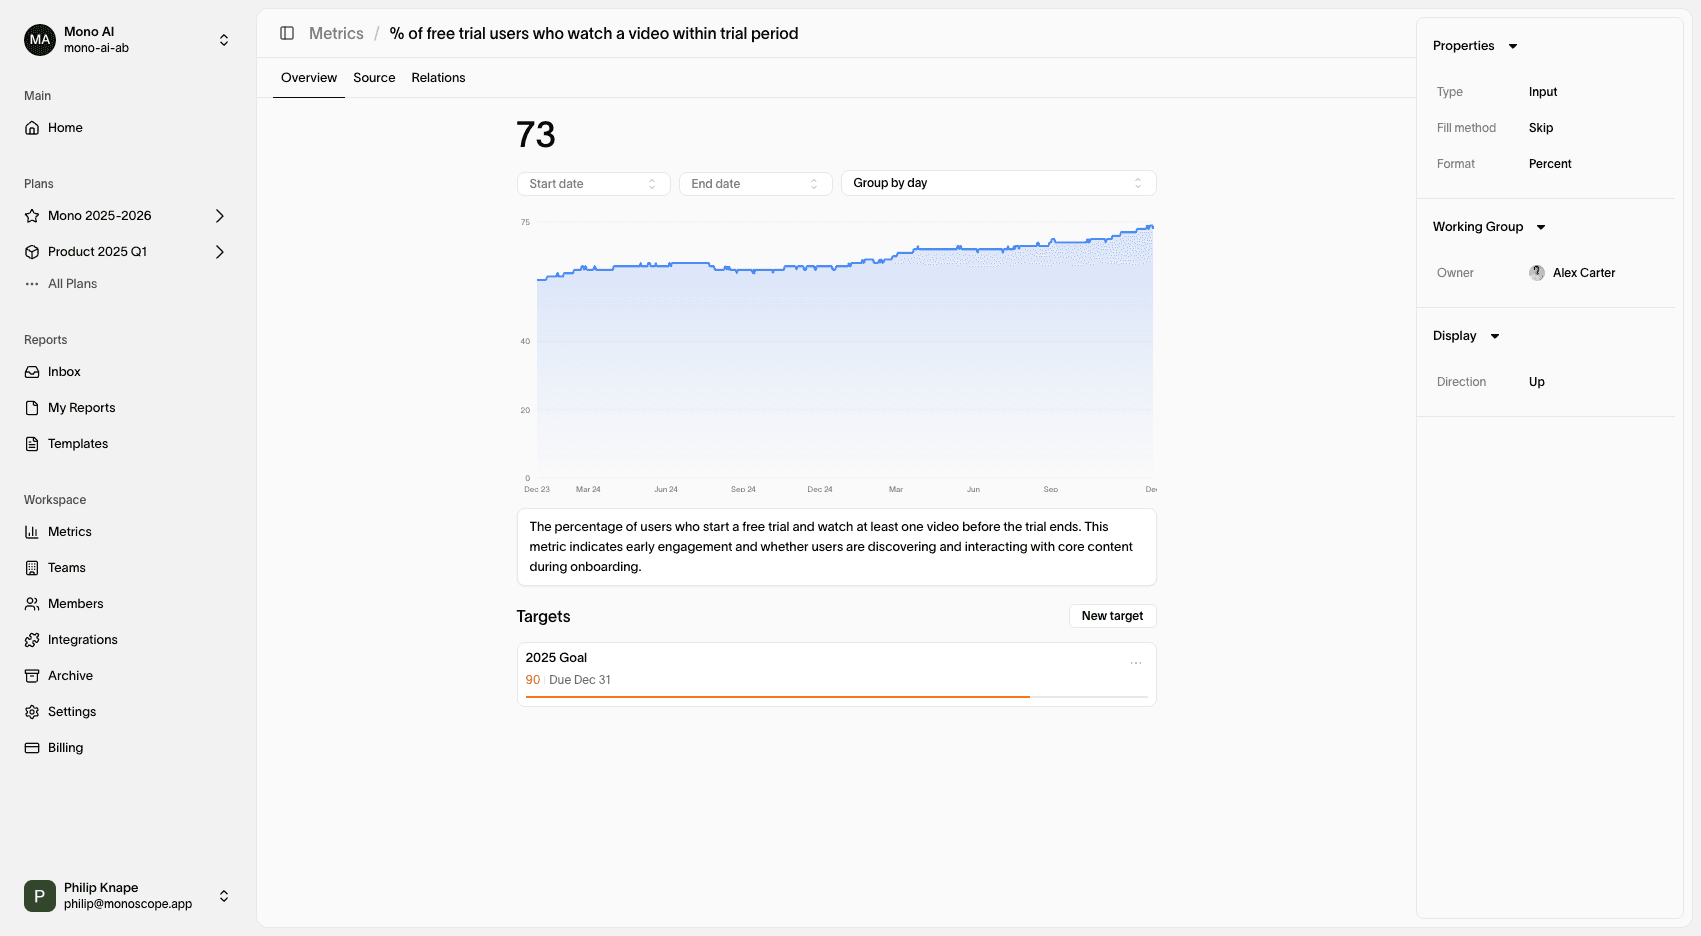
Step 1 — Open a Metric
Go to the metric where you want to track progress. You can add a target when creating a new metric or editing an existing one.
Step 2 — Add Target
Click “Add Target” in the metric sidebar or overview tab. You’ll see the target configuration form.
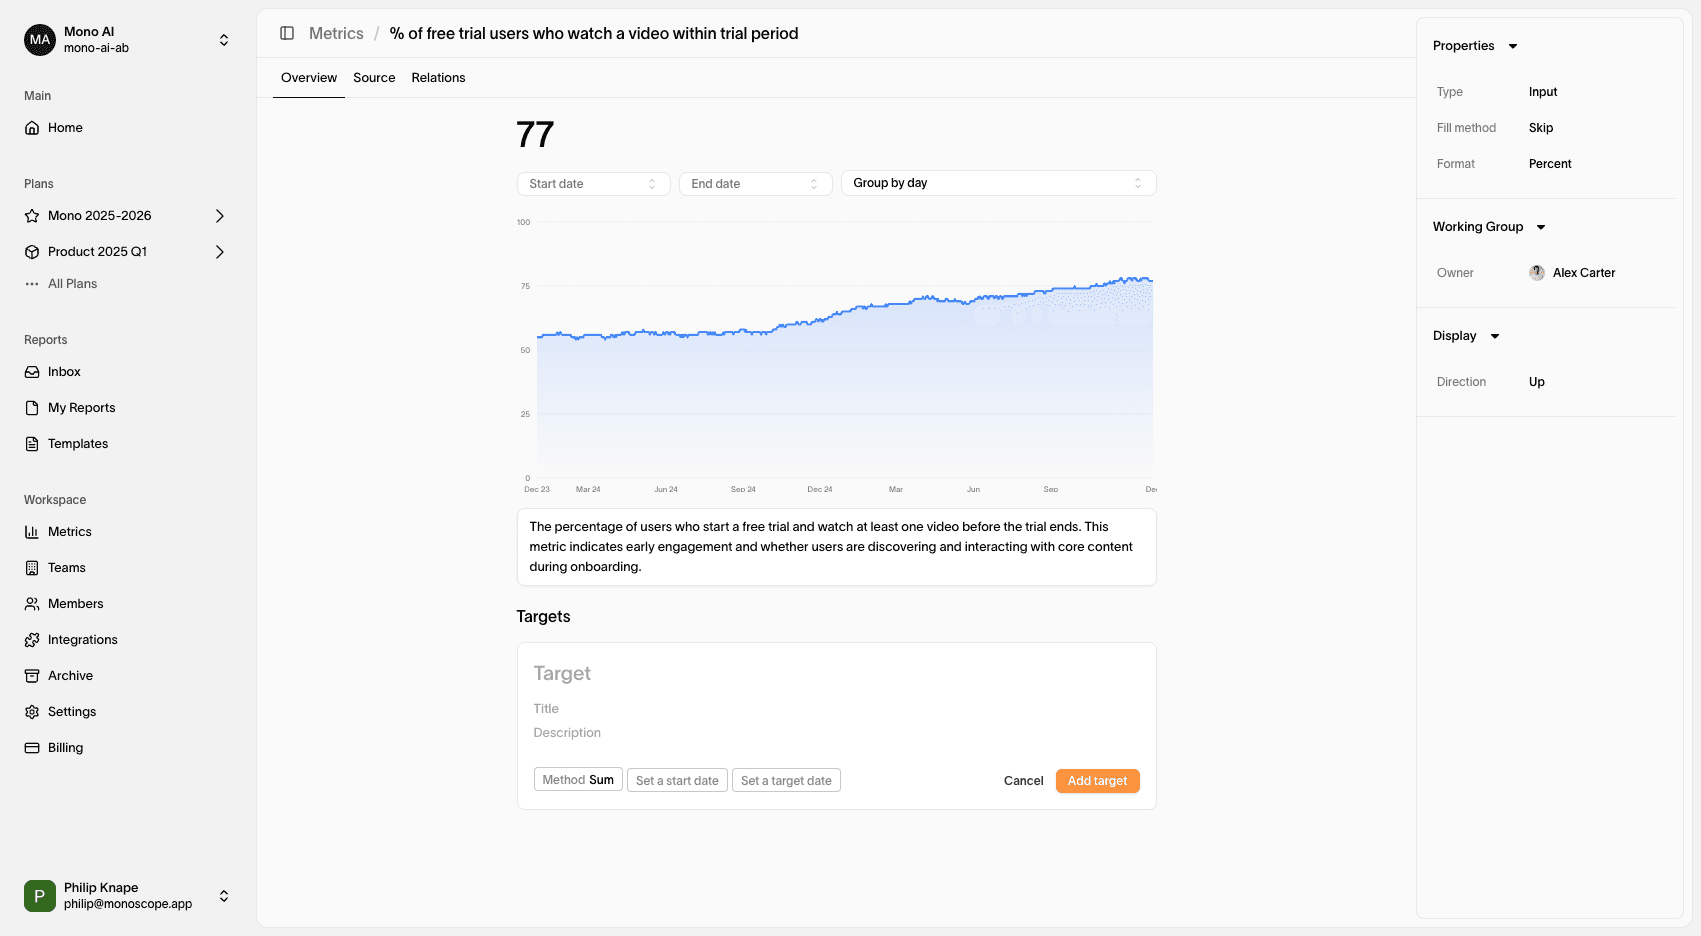
Step 3 — Set Target Details
Define your target by filling in these fields:
| Field | Description |
|---|---|
| Target Value | The outcome you want to reach (e.g., 10,000 users). |
| Start Date | When tracking should begin. |
| End Date | When you aim to hit the target. |
| Aggregation Type | How progress is calculated — Sum, Average, Last, Min, or Max. |
| Direction | Whether higher or lower values represent success (↑ up is good, ↓ down is good). |
Step 4 — Save
Click Save Target — Monoscope will automatically calculate and update progress as new metric data arrives.
How Progress Is Calculated
Monoscope automatically determines progress between your Start Date and End Date.
| Term | Definition |
|---|---|
| Current Value | The metric’s latest aggregated value within the target period. |
| Progress % | (Current Value / Target Value) × 100, adjusted for direction. |
| Status | Whether the metric is on track, behind, or exceeded. |
Example:
If your target is 10,000 Active Users by Dec 31, and you’re at 8,000 on Oct 1, you’ve reached 80% progress — and Monoscope will show an “On Track” status if the growth rate aligns with the timeline.
Viewing Targets on Canvases
When metrics appear on a Monoscope Canvas, their attached targets are displayed directly inside the metric card.
Each card includes:
- A progress bar showing proximity to the target.
- A target label (e.g., “Target: 10,000 by Dec 31”).
- A time remaining indicator.
- Hover details with aggregation type and timeframe.
This makes it easy to see not just what’s changing, but whether it’s enough — connecting performance with intent.
Why It Matters
Combine Targets with Initiatives to tell a complete strategic story:
“We believe this initiative will move this metric toward this target by this date.”
Targets help teams:
- Define success explicitly
- Stay aligned on measurable outcomes
- Detect drift early
- Maintain focus on impact, not just activity
In the Strategy Graph, targets add directionality — turning static metrics into evolving, measurable commitments that drive learning and accountability.
Example
| Metric | Target | Progress | Status |
|---|---|---|---|
| Monthly Active Users | 10,000 by Dec 31 | 8,000 (80%) | ✅ On Track |
| Revenue | $1M by June | $650K (65%) | ⚠️ Slightly Behind |
| Churn Rate | < 2% | 2.3% | 🔴 Off Track |
Summary
Targets turn strategy into measurable motion. They make progress visible, align intent with execution, and close the loop between what teams do and why it matters.
“Metrics measure performance. Targets measure purpose.”