What is a Monoscope Canvas?
The Monoscope Canvas is where strategy, data, and decisions meet. It’s a space for connecting metrics and initiatives, exploring how they influence each other, and running strategic analyses to uncover leverage, dependencies, and opportunity.
Instead of separating planning, execution, and measurement, the Monoscope Canvas keeps them in one living system — allowing your hypotheses, initiatives, and outcomes to stay continuously connected and learn from real data.
Why It Matters
Most teams plan work in one place and measure results in another. The Monoscope Canvas closes that gap by showing how initiatives actually drive outcomes — and by providing a shared context for both strategic thinking and data-driven validation.
It turns metrics and initiatives into a connected system you can reason about, not just track.
The Monoscope Canvas is a strategic surface: it connects decisions (initiatives) to outcomes (metrics) and preserves context for analysis.
Monoscope Canvas Structure
A Monoscope Canvas consists of three core elements:
- Metrics — the outcomes and inputs that describe how your system performs.
- Initiatives — the initiatives designed to influence those outcomes.
- Notes — contextual annotations for documentation and insights.
The relationships between metrics and initiatives create the foundation for your analyses and reveal how effort turns into results.
Metrics
Metrics represent quantitative outcomes or drivers. They connect to your real data sources and contain historical performance that powers deeper analyses.
When you link metrics together, the Monoscope Canvas can detect and model relationships such as:
- Correlation and direction of movement
- Relative contribution to shared outcomes
- Variance explained and systemic influence
Metrics give you the quantitative lens on how your business behaves over time.
Initiatives
Initiatives are strategic initiatives — the decisions and investments your team makes to influence key metrics. Each initiative includes a hypothesis, expected impact, confidence, reach, and effort level. They can link to tactical work items in Jira or Linear, but the focus remains strategic: what you believe will create meaningful change.
When connected to metrics, initiatives provide the basis for estimating:
- Expected and actual impact
- Relative leverage across initiatives
- Strategic confidence vs. execution risk
Initiatives show where you’re applying pressure — and how that pressure performs.
Notes
Notes provide context and qualitative insight. They can be used to record assumptions, discoveries, or commentary directly on the canvas, keeping reasoning visible alongside data.
Notes do not form relationships — their role is to enrich understanding and narrative context.
Notes don’t affect analyses directly. Use them to capture context and rationale so decisions remain interpretable.
Relationships
Relationships define how metrics and initiatives influence each other. They give structure to your system and allow analyses to reason about cause, effect, and dependency rather than just correlation.
Relationship Types
| Relationship | Description | Example |
|---|---|---|
| Metric → Metric | Shows how one metric influences or depends on another. Used in Driver and Growth Loop Analyses. | ”Activation rate drives retention rate.” |
| Initiative → Metric | Indicates how a strategic initiative contributes to or affects a specific metric. Used in Initiative Impact Analysis. | ”Redesign onboarding contributes to signup completion.” |
| Metric → Initiative | Represents metrics that enable or block progress on a initiative. | ”API uptime enables performance improvement project.” |
| Initiative → Initiative | Expresses strategic or operational relationships between initiatives — e.g., dependencies, enablers, or blockers. | ”Infrastructure upgrade enables mobile launch.” |
Relationship Attributes
Each relationship can include additional detail to refine analyses:
- Type: drives / enables / blocks / contributes / depends_on
- Expected impact: positive / negative / neutral
- Confidence: low / medium / high
- Reach: percentage of affected users or scope
- Lag: estimated time before effect appears
These attributes turn assumptions into structured, analysable logic.
Common Workflows
Monoscope Canvases adapt to different strategic and analytical needs — from planning cycles to discovery work. Each workflow helps you understand, prioritise, and validate where leverage truly exists.
| Workflow | Description |
|---|---|
| Quarterly Planning | Prioritise and commit the right initiatives for the next cycle using impact, confidence, and effort. |
| North Star & Drivers | Map your primary KPI and its supporting metrics to reveal where leverage sits. |
| Growth Loops | Identify and strengthen self-sustaining systems that compound over time. |
| Marketing Allocation | Balance spend and attention across channels to maximise ROI. |
| Opportunity Solution Tree | Explore and validate problem–solution pathways before committing new initiatives. |
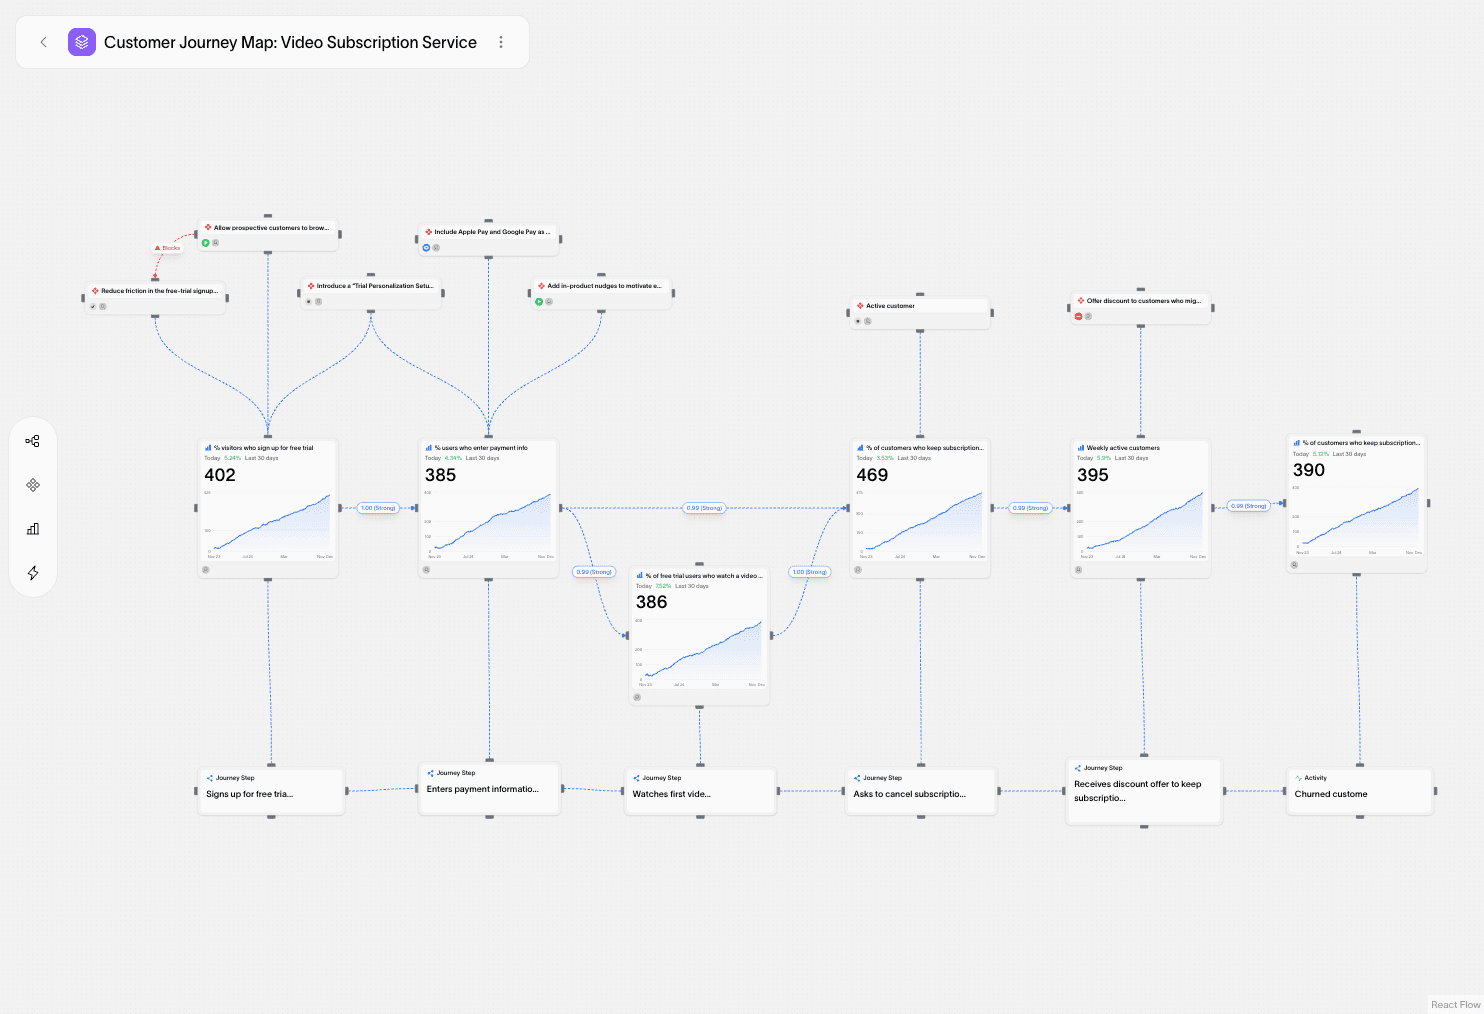
| Customer Journey Map | Visualise how customers move through your funnel to uncover drop-offs and activation opportunities. |
Each workflow can evolve into its own focused analysis, powered by the same underlying relationships.
Data & Integrations
Monoscope Canvases connect directly to your analytics, revenue, and marketing systems, keeping metrics continuously updated.
Supported data includes:
- Time-series performance (daily, weekly, monthly)
- Metric metadata (owner, direction, unit, target)
- Confidence and reach data for initiatives
- Historical records for trend and impact analyses
High-quality data and clear relationships yield stronger analyses and more actionable insights.
Best Practices
- Start small: begin with a few key metrics and initiatives.
- Be explicit: add confidence, lag, and impact direction to make reasoning visible.
- Validate continuously: compare expected vs actual outcomes as data accumulates.
- Iterate relationships: update links and attributes as your understanding improves.
- Keep it living: the Monoscope Canvas evolves with your strategy — not just your reporting.
Clarity beats coverage. A few well-understood metrics and initiatives outperform sprawling canvases with weak relationships.
Summary
The Monoscope Canvas transforms fragmented data and disconnected plans into a cohesive strategic system. By connecting metrics and initiatives through structured relationships, you can see how your organisation truly operates — and apply pressure where it matters most.
It’s not just a visualization of your work. It’s how you reason about growth, measure progress, and refine strategy — all in one place.
Monoscope Canvases provide the system of record for strategy; Decision Loops ensure that changes in data lead to deliberate, recorded actions — keeping your canvases continuously aligned with reality.